Contrary to Common Perception, Density is Meaningless: Cities Need More Streets, Not More Parks
Self admittedly, modernist planners do not fully understand the concept of density. Simple as counting how many people or units of buildings are found on a unit of land first appears, what density MEANS—is elusive. The complex, three-dimensional and multi-scalar relationships and flows of a city cannot be reduced to a mere number.
Thought of “high density” brings to some people associations of efficient, environmentally friendly, diverse, culturally rich, and lively, economically competitive places. Density is said to encourage efficient infrastructure at lower cost. It is said to increase safety, social cohesion, commercial dynamism, and walkability; to consume less rural land, and engender sustainability.
But the moment we try to explain density without a common definition, complex variables, weightings, and notions enter the fray. To some people it means crime, pollution, and poverty, while “low density” brings to them ideas of home ownership, green lawns, and family life. Yet others associate it with bland homogeneity, isolation, and sprawl.[1]
Clearly home ownership and families can exist in “high density” areas like Manhattan. One can find culturally rich and economically competitive “low density” places such as Los Angeles. And while the perception of a built environment are related to measurable characteristics, “good” and “bad” urban environments appear at any density.”[2]
High, medium and low densities vary significantly both in the way they are measured, in the degree of measurement, and in how they are perceived. Without consensus on how to accurately measure or calculate density, the result is confusion among planners. Policy makers and NIMBY groups mount barricades with their ideas of density—pro or con—inscribed on their banners. But using any density number as hard data, is at best very crude. [3]
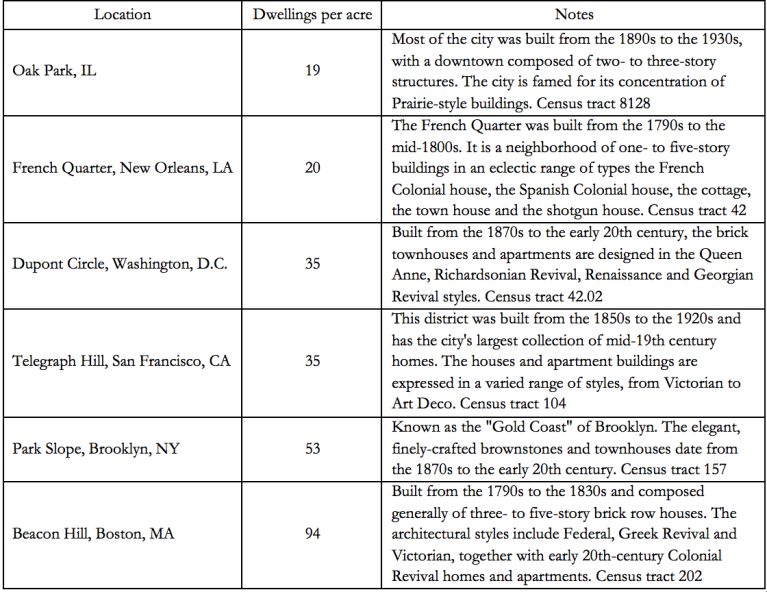
The performance of contemporary development contrasts poorly with historic places that are landmarks of good urban fabric. Many of the United States’ best-loved communities have surprisingly high densities. This calculation of dwelling units per acre of land includes streets, parks, and commercial and civic buildings. If such non-residential uses were subtracted, the density figures would be even higher. 2000 U.S. Census; Aurbach, Laurence, “Delightful Density.” The Town Paper, Fall 2002, Vol. 4, No. 3, p. 1.
Stemming mainly from the multitude of definitions of the term in different disciplines and under different contexts, “density” may be empty gauge of urban quality. Proof of that perhaps lies in the many types of density that are defined. A few of these include:[4]
- Physical density is the number of individuals or physical structures in a given geographical unit.
- Population density is the number of people per square kilometer or square mile.
- Regional density is the number of dwelling units in any given area.
- Gross density includes all land in the study area.
- Net density excludes certain land uses,” and
- Employment density is the number of jobs in a given area.
- Occupancy density is the number of occupants on a floor area or in a building.
- Plot ratio (floor area ratio) is the total floor area of a build divided by the land area of the lot upon which it is built
- Site coverage is the ratio of the building footprint to the area of the site.
- Building density relates to the shaping of urban form, but the appealing idea of a correlation between density and built form is misleading. Depending on how it is calculated, extremely different building forms, e.g. Islamic courtyard houses and Maine farm houses, have the same density. Meanwhile, the same forms can be built at different densities. To overcome that hurdle, modernist planning takes into account.
- Residential density is the ratio of a population to residential land area. But there is no consensus as to the definition of net and gross areas. Whereas in the UK, net residential area refers to land covered by residential development, along with gardens and other spaces that are physically included in it and generally half the width of adjacent roads; in Hong Kong and some states in the US, it consists only of the residential parcels while roads, parks and other uses are excluded.
- Job density shows how many people on a workday may be present in a place. That sum can be weighted by the amount of space an individual occupies residing or working and furthermore by the number of hours they are present at a location.
- Intensity refers to the concentration of commercial and service activities on the ground floors along city streets,[5] and
- Urban Intensity is the sum of residential density and job density. [6]
- Weighted density assigns the standard density of each census tract, weight proportional to its share of the total.
- Perceived density is a person’s perception and estimate of the number of people present in a given area.[7] Perceived density distinguishes between social and perceptual aspects:
- Spatial density is the perception of density as relating to spatial elements such as height, spacing and juxtaposition; and, to describe the interaction between people.
- Social density involves sensory modalities, spacing, physical elements, territorial boundaries, hierarchy, the size and nature of the group involved, its homogeneity and rules for behavior.[8]
In terms of human perception, it is not the physical density per se but the interaction between individuals and the physical environment that is important. Indeed, individual cognitive attributes and socio-cultural factors are also contributing to the notion of perceived density.” But ultimately, looking to density as a cause rather than as a measurable effect relevant to its context alone is apparently wrong. Material correlations, such as miles of sewers per high medium and low unit or floor counts are possible, the lack of correlation to human experience and behavior make the concept of density weak.
Planetizen’s recent Three Studies That Show Density Doesn’t Determine Car Travel, confirmed that increased density did not reduce automobile use. Instead, it reaffirmed the logical, namely that travel was strongly entangled with such disparate variables as land use, personal income, perceptions of freedom, and personal stage in life.[9]
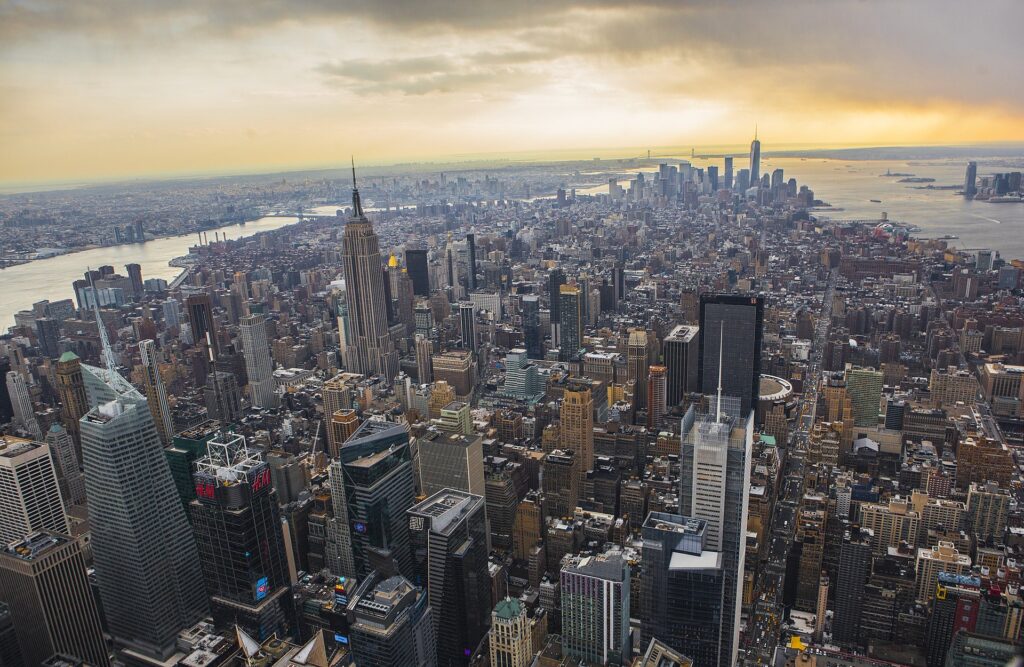
The uneven distribution of uses across the urban landscape skews measurements so much that no two places are actually comparable. Measured in certain ways, Phoenix and New York have virtually the same density.[10] But however dense, the prettier the streets or buildings are, the less dense they will appear, as many of the world’s best-loved communities show; they have surprisingly high densities.[11]
Arguably, the best experiential and qualitative measure of density is Schocken and Bernardino’s Public Space Allocation (PSA). It derives from Maslow’s theory,according to which chances for human survival and “self-actualization” directly correlate to the amount and diversity of human contacts a person has.Calculating the area of public space available per person in an urban fabric indicates the chances that people may have to enjoy the benefits of interaction and presence in public space, in correspondence with the instinctive human need for physical interaction.[12] Manhattan’s Central Park comprises 3.9% of the borough’s land area and the total parks in Manhattan cover 12.4% of Manhattan’s total 33.59 square miles. Adding the paved streets and sidewalks, we get to 49.8% of public space.[13]
Schocken and Bernardino recommend a “Goldilocks” PSA range of ten to a hundred square feet (1–10 m2) of public space per person. Their calculations of the number of junctions in streets and the average distance between doorways of homes, offices, and shops validate classic plan block dimensions and the rule of having buildings no larger than a quarter of a block.
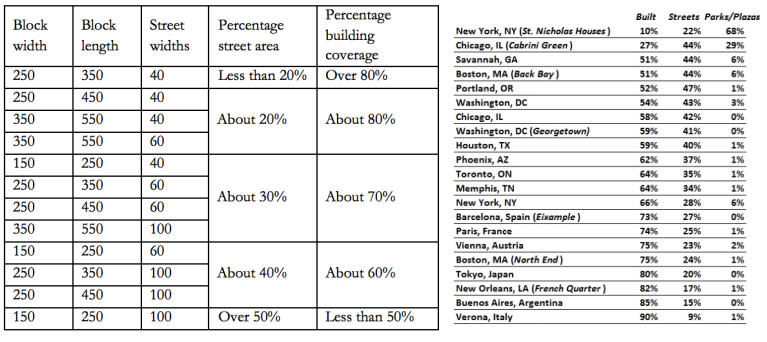
They confirm knowledge-base conventions dictated by walking speed, which organically place doorways no more than a hundred feet (30 m) apart, and door and windows rhythms as generated by the columniation of the Orders. When less than 30 percent of the land of urban fabric is dedicated to the street pattern, congestion arises. The street pattern in Latin American, Asian, and African sprawl suburbs tends to be less than 10 to 15 percent. Contrary to common wisdom, cities need more streets, not more parks.[14]
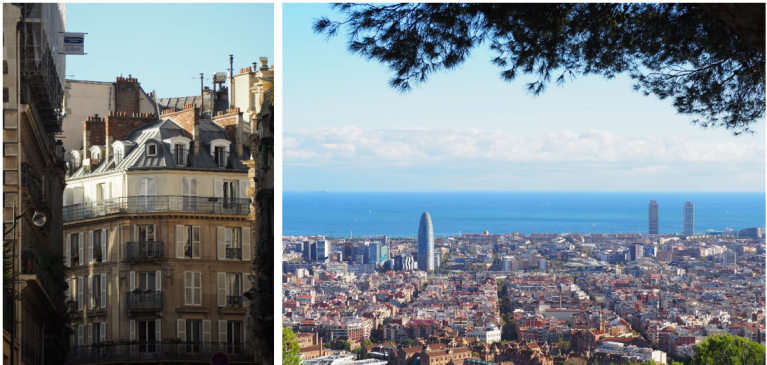
The precedents of Paris and London suggest that the 4:1 to 6:1 FARs of six-to-eight-story Haussmannian buildings accommodate well-lit private gardens and public spaces without congesting the fabric. With their buildings four to six stories tall at their cornice and with one or two stories under the roof, Paris’s streets are not gloomy corridors. The houses’ small private gardens are not dank chasms.[15]
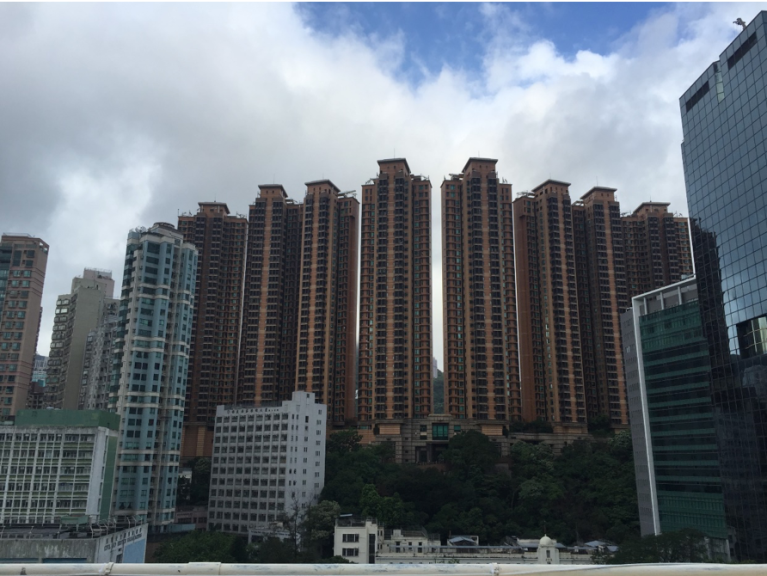
Indeed, most of the beautiful cities surviving today were conceived with buildings of six or fewer floors, refuting the “scarcity of land” argument currently promoted worldwide. There is no proven correlation between demographic pressure and high-rise buildings. The density of central Paris is far greater than that of Hong Kong.[16]Though Hong Kong’s urban areas are only a fraction of its total territory, its remarkably low overall density, 17,311 people per square mile, reflects that its cityscape suffers less from a scarcity of land or from road and building congestion as suggested by some, and more from badly used land resulting from bad planning—and government speculation in that land. [17]
Measuring less than 23 square miles, Manhattan Island is by far the most densely populated city in America, much denser than Paris. It houses 66,429 people per square mile while Paris intra muros houses only 52,387. But Paris is the capital of the Ile-de-France region, which covers 4,648 square miles and has a population of 10,952,011, while the New York metro area, with 21,923,089 people, covers 13,847 square miles, three times as much.
While New York has both extreme population density at its core and sprawl everywhere else, the city of Paris and Ile-de-France offer a sequence of environments of Classic Plan metropolitan lifestyle options ranging from apartments in densely-populated urban cores to single-family homes in the countryside. [18]
But in the proliferation of twentieth-century utilitarian high-rise buildings outside its center, Paris doubled its population, sprawling to over fifteen times the size of its center. Sadly, Paris’s closest socioeconomic equivalent to America’s inner cities and ghetto housing projects are its strictly modernist banlieues, built during the 1960s and 1970s.
The history of these suburbs parallels that of the troubled American inner cities subjected to mid-twentieth century Urban Renewal. Unfamiliar to tourists, Paris’s banlieues are where the November 2005 Parisian rioting took place, areas which more recently have been breeding grounds for radical religious and homegrown terrorism.
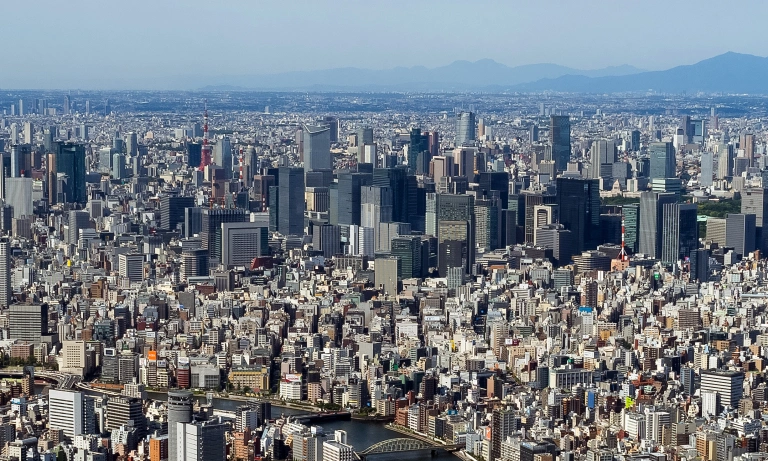
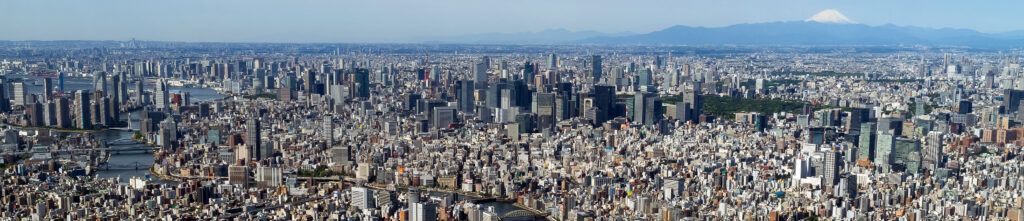
Laid flat, the gargantuan Asian high-rise developments would create nice, pleasant, three-to-five-story fabric. Ultimately, Manhattan would not have been “Manhattan” without “Manhattanization,” but it would have been beautiful.
End Notes:
[1] Miller, E. & A. Shalaby. 2000. Travel in the Greater Toronto Area: Past and Current Behaviour in Relation to Urban Form. Toronto: Neptis Foundation. Pp. 23–24, 42; Cervero, R. 1998. The Transit Metropolis: A Global Inquiry. Washington, D.C.: Island Press. ch. 3; Newman, P. & J. Kenworthy. 1999. Sustainability and Cities: Overcoming Automobile Dependence. Washington, D.C., Island Press. ch. 3; Pushkarev, B. S. & J. M. Zupan. 1977. Public Transportation and Land Use Policy. Bloomington: Indiana University Press, 1977.: ch. 2; Churchman, Arza. ‘Disentangling the concept of density’, Journal of Planning Literature, vol 13, no 4, 1999, pp 398–99.
[2] Alexander, E.R. 1993. “Density Measures: A Review and Analysis,” Journal of Architectural and Planning Research (10:3) 181–202.
[3] Hitchcock, J. 1994. A Primer on the use of density in land use planning. Papers on Planning and Design No. 41. Toronto: Programme in Planning, University of Toronto; For a discussion of the shift from anti-congestion to anti-sprawl, see Sloane, David Charles. “From Congestion to Sprawl” Journal of the American Planning Association 72. No. 1 (2006): 10-18.
[4] Definitions of density from Cheng, Vicky, “Understanding Density and High Density” in Ng, Edward, (Ed.), Designing High-Density Cities: For Social and Environmental Sustainability, Routledge, New York, 2009.
[5] Andres Sevtsuk, Onur Ekmekci, Farre Nixon, Reza Amindarbari, “Capturing Urban Intensity” in R. Stouffs, P. Janssen, S. Roudavski, B. Tunçer (eds.), Open Systems: Proceedings of the 18th International Conference on Computer-Aided Architectural Design Research in Asia (CAADRIA 2013), 551–560. 2013,Hong Kong, and Singapore.
[6] To account for job volatility, diurnal cycles and space occupancy (an office worker occupies considerably less space than a restaurant worker) the densities may be weighted.
[7] Rapoport, Amos, ‘Toward a redefinition of density’, Environment and Behavior, vol 7, no 2, 1975. pp133–158.
[8] Chan, Y. K. (1999) ‘Density, crowding and factors intervening in their relationship: Evidence from a hyper- dense metropolis’, Social Indicators Research, vol 48, pp103–124
[9] https://www.planetizen.com/features/106433-three-studies-show-density-doesnt-determine-car-travel.
[10] Cheng,, 2009; Churchman, “Disentangling the Concept of Density,” 389–411; Y. K. Chan, “Density, Crowding and Factors Intervening in Their Relationship: Evidence from a Hyper- Dense Metropolis,” Social Indicators Research 48 (1999): 103–124. In Manhattan, land area exclusive of major bodies of water and streets is 470,000,000 square feet (10,789.72 acres or 16.86 square miles), 50.2 percent of its total area. The 840 acres (1.31 square miles) of Manhattan’s Central Park are 3.9 percent of the borough’s land area. The total parks in Manhattan cover 2,658.75 acres (4.15 square miles), making up 12.4 percent of Manhattan’s total 33.59 square miles of area.Adding the paved streets and sidewalks, we get to 49.8 percent of public space.“Parks by Total Acreage (Parks Greater or Equal Than 0.5 Acres),” The Official Website of the City of New York, www1.nyc.gov/assets/buildings/pdf/dpr_park_list.pdf.
[11] A person’s perception and estimate of the number of people present in a given area. Amos Rapoport, “Toward a Redefinition of Density,” Environment and Behavior 7, no. 2 (1975): 133–158; Cheng, 2009; M. Bonnes, M. Bonaiuto and A. P. Ercolani, “Crowding and Residential Satisfaction in the Urban Environment: A Contextual Approach,” Environment and Behavior 23, no. 5 (1991): 531–552; P. G. Flachsbart, “Residential Site Planning and Perceived Densities,” Journal of the Urban Planning and Development Division 105, no. 2 (1979): 103–117.
[12] Hillel Schocken and Raquel Ludermir Bernardino, “The Urban Genome: A Universal Toolkit for Cities,” paper, Tel Aviv University and Federal University of Pernambuco, 2015; A. H. Maslow, “A Theory of Human Motivation,” Psychological Review 50 (1943): 370–396. Simply stated, it is generally in the individual’s interest to have contact with many people to increase their chances of finding a suitable mate or people with whom to exchange goods.
[13] Gardner, Charlie, Density on the Ground: Cities and Building Coverage, oldurbanist.blogspot.com., 28 June, 2011. http://oldurbanist.blogspot.com/2011/06/density-on-ground-cities-and-building.html
[14] UN-Habitat, 2013.
[15] Organization for Economic Cooperation and Development, Compact City Policies: A Comparative Assessment, OECD Green Growth Studies (Paris: OECD Publishing, 2012), 32–33. Notably, when developers are allowed to exceed six to eight floors, land values rise exponentially, creating pressure for taller buildings and causing a vicious circle, which leads to degrading the fabric and justifying a suburban exodus (Krier, Architecture: Choice or Fate). Defenseless in the face of taller redevelopment, the public winds up footing the bill for accommodating undue power, traffic, and sewer demands caused by the financial overexploitation of urban land.
[16] OECD, Compact City Policies, 32–33.
[17] Krier, “The Future of Cities”; Richard Florida, “The Relationship between Skyscrapers and Great Cities,” CityLab, January 28, 2016, http://www.citylab.com/design/2016/01/skyscrapers-cities-tall-buildings/431655/.
[18] Hall, Eliza, Divide and Sprawl, Decline and Fall: A Comparative Critique of Euclidean Zoning, University of Pittsburgh Law Review, ISSN: 0041-9915, Vol: 68, Issue: 4, 2007. pp. 915-952.
WELCOME!
Get In Touch
Please get in touch with us
to discuss your requirements.
Please get in touch with us
to discuss your requirements.